

RFID Table Revenue Tracking: Data-Driven Casino Floor Optimization
Revenue optimization on the casino floor has historically relied on aggregate data: drop amounts, win percentages, and manual observations of table activity. While these metrics provide a high-level view, they lack the granularity needed to identify specific operational inefficiencies and revenue opportunities. RFID-enabled gaming tables generate a continuous stream of chip-level data that casinos can analyze to optimize floor layout, table mix, staffing, and game offerings with unprecedented precision.
From Aggregate to Granular Revenue Data
Traditional table game reporting relies on three metrics: drop (total chips purchased), win (total chips paid out to the casino), and win percentage (win divided by drop). These metrics are calculated daily or weekly, based on manual counts of table drop boxes and cage transactions.
While useful for high-level reporting, these aggregate metrics hide significant operational detail. A baccarat table showing a 12% win rate over a week might be generating that win through consistent performance, or it might be highly profitable during day shifts and losing money during overnight shifts. Without granular data, the casino floor manager cannot distinguish between these scenarios and cannot take targeted action to improve performance.
RFID tables generate data at the chip level and the hand level. Every chip movement is recorded with a timestamp, a zone identifier, and a player identifier (for rated players). The system calculates bet sizes, win/loss per hand, and cumulative performance per table, per shift, per dealer, and per pit. This granular data transforms floor optimization from an art based on observation to a science based on measurement.
Table Performance Analytics
The most immediate application of RFID revenue data is table performance analytics. For each table, the system generates: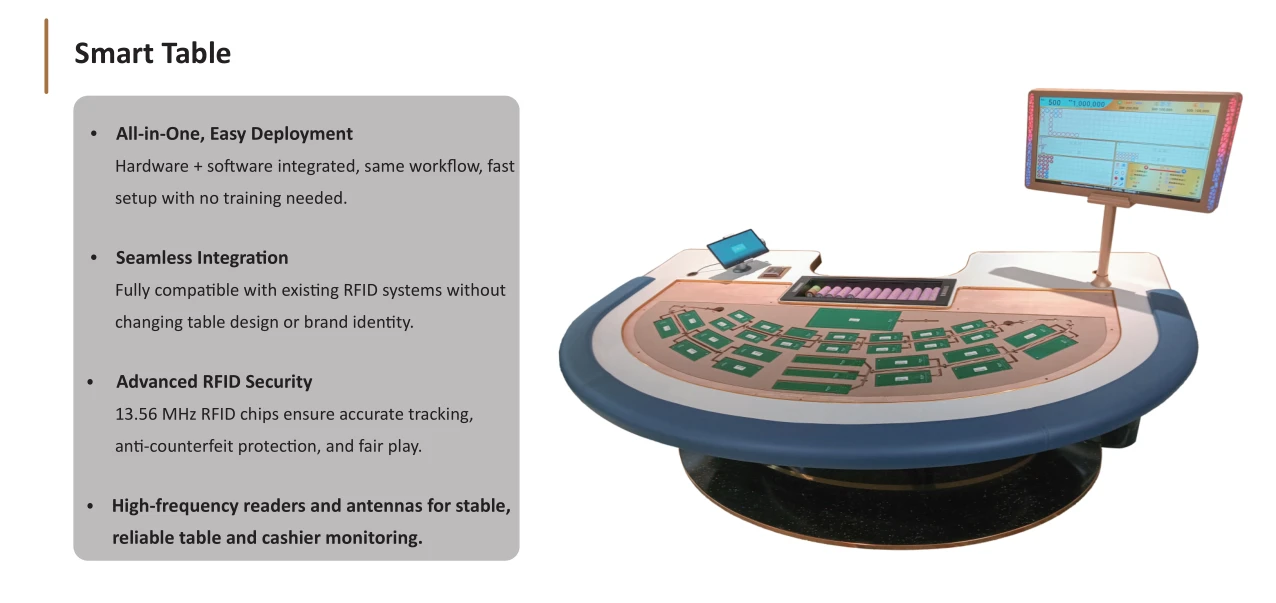

– **Drop per hour:** Total chips purchased by players at the table, aggregated by hour. This metric identifies tables that are attracting high-volume play and tables that are underperforming.
– **Win per hour:** Total chips retained by the casino, aggregated by hour. This metric identifies tables that are generating actual profit, as opposed to tables with high drop but low win (suggesting unfavorable game conditions or inexperienced players).
– **Hands per hour:** The number of hands or rounds completed per hour. This metric identifies dealers who are dealing slowly (reducing throughput) and tables that are experiencing delays due to game complexity or player behavior.
– **Average bet size:** The mean bet size per player, per table. This metric helps floor managers identify whether a table is attracting the target player demographic.
These metrics can be sliced by time of day, day of week, dealer, and pit location. A floor manager can quickly identify that the $10 minimum baccarat table near the high-limit area is generating $2,400 per hour in win during Friday nights but only $600 per hour on Tuesday mornings. This insight supports targeted actions: increasing the minimum bet on Friday nights to capture more revenue, or converting the table to a different game on Tuesday mornings to improve utilization.
Pit-Level Optimization
RFID data enables pit-level optimization that was previously impossible. A pit is a cluster of tables managed by a single pit manager. Traditionally, pit performance was measured by aggregating the performance of all tables in the pit, without visibility into table-to-table variations.
With RFID data, pit managers can optimize table mix in real time. If Table A is generating high drop but low win (players are betting heavily but the casino is losing), the pit manager might increase the table’s minimum bet to filter out low-value play. If Table B is generating low drop but high win percentage (experienced players are winning consistently), the pit manager might rotate the dealer or adjust the game rules within regulatory limits.
Pit-level data also supports staffing optimization. RFID systems track the number of active players per table, the wait time for seating, and the turnover rate of players. If a pit has 4 tables but only 2 are consistently full, the floor manager can reassign the dealer from a third table to the cage or another pit, reducing labor costs without affecting player experience.
Dealer Performance and Training
RFID revenue tracking provides objective data on dealer performance, which has traditionally been assessed subjectively through observation and player feedback Smart Gaming Table. The system tracks:
– **Hands per hour by dealer:** Faster dealers generate more hands per hour, which directly increases the casino’s theoretical win. A dealer who consistently deals 20% more hands per hour than the pit average is a significant revenue asset.
– **Error rate by dealer:** The number of payout errors, chip handling errors, and procedural violations per 1,000 hands. Lower error rates reduce variance and improve player trust.
– **Player retention by dealer:** The average time players remain at a table when a specific dealer is dealing. Longer retention times correlate with higher player satisfaction and increased revenue per player.
This data supports targeted training programs. If a dealer has a slow hands-per-hour rate, they can receive dealing speed training. If a dealer has a high error rate, they can receive chip handling and game procedure refreshers. The training is objective, measurable, and directly tied to revenue outcomes.
Game Mix Optimization
RFID data reveals which games are most popular with which player segments at different times and in different locations. This insight supports game mix optimization — the strategic allocation of table games across the floor to maximize revenue.
For example, RFID data might show that:
– Baccarat tables near the high-limit area generate 3x the drop of baccarat tables near the entrance, suggesting that high-value players prefer the high-limit area and that additional baccarat tables should be added there.
– Poker tables generate lower drop per hour than blackjack tables but attract younger players who spend more on food, beverage, and hotel, suggesting that poker tables should be evaluated on total property revenue rather than table revenue alone.
– Niu Niu tables generate high turnover but low average bet size, suggesting that they are best positioned as mass-market attractions rather than high-limit offerings.
Game mix optimization based on RFID data typically yields 5-15% improvements in total floor win, depending on the property’s starting configuration and the quality of the data analysis.
Dynamic Pricing and Table Minimums
RFID revenue data enables dynamic pricing — adjusting table minimums in real time based on demand, player behavior, and table performance. Traditional table minimums are static, set once and adjusted infrequently. Dynamic pricing uses RFID data to optimize minimums continuously.
The system monitors table occupancy, average bet size, and win rate in real time. When a table is full and the average bet size is below the property’s target, the system can recommend a minimum increase. When a table is empty and the minimum is above the local market average, the system can recommend a minimum decrease. The adjustments are made by the pit manager or floor manager, informed by real-time data rather than intuition.
Dynamic pricing based on RFID data has been shown to increase table win by 8-12% without reducing player satisfaction, as long as the adjustments are gradual and communicated clearly to players.
Revenue Forecasting and Budgeting
RFID data improves revenue forecasting and budgeting by providing a larger, more granular dataset for predictive modeling. Traditional forecasting uses historical drop and win data at the monthly or weekly level, which smooths out short-term variations and makes it difficult to predict the impact of specific events or changes.
RFID data enables forecasting at the daily, hourly, and even hand-level. A property can model the revenue impact of adding a high-limit pit, changing the game mix, or adjusting staffing levels. The forecasts are based on actual performance data rather than rough estimates, and they can be updated in real time as new data arrives.
This capability is particularly valuable for budgeting. Properties can allocate marketing spend, complimentary services, and capital investments based on the revenue contribution of specific player segments, games, and pits. The result is more efficient resource allocation and higher return on investment for every dollar spent.
Frequently Asked Questions
How does RFID revenue tracking handle rated versus unrated players in the data?
The system tracks chip movements by table position, regardless of whether the player is rated. For rated players, the position data is linked to the player’s ID in the database, enabling player-level revenue analysis. For unrated players, the data is aggregated at the table level and the position level. This approach provides complete revenue data for all tables while maintaining the ability to analyze individual player behavior for rated customers. The system can be configured to prompt unrated players for rating during extended play, gradually converting unrated data into rated data over time.
What is the typical improvement in floor win after implementing RFID revenue tracking?
Casinos that deploy RFID revenue tracking and act on the data typically see 5-15% improvements in total floor win within the first 12 months. The improvement comes from table mix optimization, dynamic minimum adjustments, dealer performance improvements, and better floor staffing. The exact improvement varies by property, with larger gains typically seen at properties that previously had limited table-level data and were making floor decisions based primarily on observation rather than measurement.
Can RFID data be used to measure the impact of marketing promotions on table revenue?
Yes. RFID systems can correlate revenue data with marketing promotions when players are rated and the promotions are logged in the player tracking system. The system can measure the revenue impact of a specific promotion — such as a tournament, a matchplay offer, or a complimentary service — by comparing revenue during the promotion period against baseline revenue for the same tables and time periods. This enables marketing teams to calculate the ROI of each promotion and to optimize the promotion mix based on actual revenue generation rather than participation rates alone.
How does the system handle data privacy for rated players?
RFID revenue tracking data is stored in encrypted databases with access controls that restrict viewing to authorized personnel only. The data is used for operational analysis and is not sold or shared with third parties. For players who have not opted into the casino’s player tracking program, the system tracks chip movements by position only and does not associate the data with personal information. The privacy practices are disclosed in the casino’s privacy policy and comply with all applicable data protection regulations in the operating jurisdiction Macaumr.
What is the recommended frequency for reviewing RFID revenue analytics?
Most casinos review RFID revenue analytics at three frequencies: real-time dashboards for floor managers and pit managers, daily reports for casino management, and weekly or monthly deep-dive analyses for executive leadership. The real-time dashboards highlight immediate opportunities (such as a slow dealer or an underperforming table) that can be addressed the same day. The daily reports identify trends that require tactical adjustments (such as changing the minimum on a specific table). The weekly or monthly analyses support strategic decisions (such as game mix changes, pit reconfigurations, and capital investments).